Crested Pigeon
Ocyphaps lophotes
ABR description
The following is extracted from the Annual Bird Report for the twelve months to June 2017.
Very common, breeding resident
Well-distributed in urban and rural areas and in woodlands, but largely absent from the wetter forests of the Cotter River catchment and surrounding NSW.
General: 3470 records up on 3407 last year. Abundance is down 12% on last year but up 8% on the 10YA and up 59% on the 30YA. Reporting rate is down 16% on last year, down 12% on the 10YA but up 22% on the 30YA. Max 101/25 May JWNR (MaM4), mean 4.4, median 2. 37 breeding records compared with 32 last year: earliest, di/6 Aug Fadden Hills Pond (CaR3); latest, 16 Apr Chifley (Bum4) with an early start for next season, di/27 May Wanniassa Hills (CaR3).
GBS: 1996 records down on 2197 last year. Abundance is down 1% on last year, down 3% on the 10YA but up 65% on the 30YA. Max 48/1wk Mar Jerrabomberra (HaL2), mean 4.3, median 3. 69 breeding records down from 94 records last year: earliest, di/4wk Jul Aranda (HaK1); latest, on/4wk Apr Page (AlB1).
Abundance
Abundance is the average number of birds of that species per survey. Where the species was observed (presence recorded) but the number of birds seen was not recorded, this is treated as a count of zero.
Abundance by year
This chart shows the abundance of Crested Pigeon between 1982 and 2017. 
Abundance by month
This chart shows the monthly abundance of Crested Pigeon. The blue lines show the abundance for the twelve months to June 2017 and the bars show the average abundance for the period 1982 to 2017. 
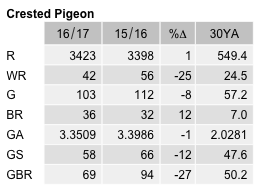
Abundance by season
This chart shows the seasonal abundance of Crested Pigeon. The blue lines show the seasonal abundance for the twelve months to June 2017 and the bars show the average seasonal abundance for the period 1982 to 2017. 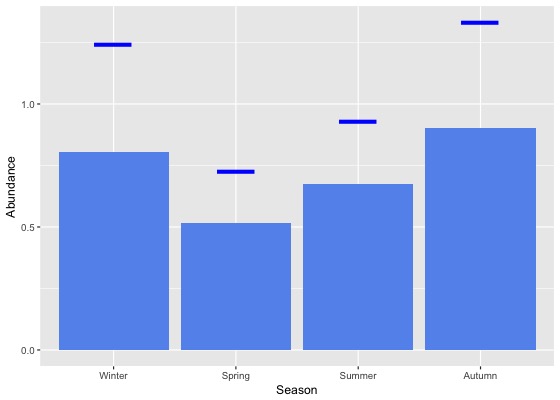
Abundance data
| Month | Season | ||||||||||||||||||
|---|---|---|---|---|---|---|---|---|---|---|---|---|---|---|---|---|---|---|---|
| Period | Jul | Aug | Sep | Oct | Nov | Dec | Jan | Feb | Mar | Apr | May | Jun | Winter | Spring | Summer | Autumn | All | ||
| All years | |||||||||||||||||||
| All | 0.8 | 0.7 | 0.5 | 0.6 | 0.5 | 0.5 | 0.7 | 0.9 | 0.7 | 0.8 | 1.2 | 0.9 | 0.8 | 0.5 | 0.7 | 0.9 | 0.7 | ||
| Previous years | |||||||||||||||||||
| All previous years | 0.7 | 0.7 | 0.4 | 0.5 | 0.5 | 0.4 | 0.7 | 0.8 | 0.7 | 0.7 | 1.1 | 0.8 | 0.7 | 0.5 | 0.6 | 0.8 | 0.7 | ||
| Previous 30 years | 0.7 | 0.7 | 0.4 | 0.6 | 0.5 | 0.4 | 0.7 | 0.9 | 0.7 | 0.8 | 1.1 | 0.8 | 0.7 | 0.5 | 0.6 | 0.8 | 0.7 | ||
| Previous 20 years | 0.9 | 0.9 | 0.5 | 0.6 | 0.6 | 0.5 | 0.8 | 1.0 | 0.8 | 0.9 | 1.3 | 0.9 | 0.9 | 0.6 | 0.7 | 1.0 | 0.8 | ||
| 10 year groups | |||||||||||||||||||
| [2007,2017) | 1.2 | 1.1 | 0.7 | 0.8 | 0.8 | 0.7 | 0.9 | 1.3 | 1.0 | 1.0 | 1.7 | 1.1 | 1.1 | 0.7 | 0.9 | 1.2 | 1.0 | ||
| [1997,2007) | 0.3 | 0.3 | 0.2 | 0.2 | 0.2 | 0.2 | 0.2 | 0.4 | 0.4 | 0.4 | 0.5 | 0.4 | 0.4 | 0.2 | 0.3 | 0.4 | 0.3 | ||
| [1987,1997) | 0.2 | 0.1 | 0.1 | 0.1 | 0.1 | 0.1 | 0.1 | 0.1 | 0.2 | 0.2 | 0.3 | 0.3 | 0.2 | 0.1 | 0.1 | 0.2 | 0.1 | ||
| 5 year groups | |||||||||||||||||||
| [2012,2017) | 1.3 | 1.2 | 0.8 | 0.8 | 0.9 | 0.8 | 0.9 | 1.3 | 1.1 | 1.2 | 1.8 | 1.3 | 1.3 | 0.8 | 1.0 | 1.3 | 1.1 | ||
| [2007,2012) | 1.1 | 0.8 | 0.5 | 0.7 | 0.6 | 0.4 | 0.8 | 0.9 | 0.8 | 0.7 | 1.3 | 0.8 | 0.8 | 0.6 | 0.7 | 0.8 | 0.7 | ||
| [2002,2007) | 0.4 | 0.4 | 0.2 | 0.3 | 0.2 | 0.2 | 0.3 | 0.6 | 0.5 | 0.6 | 0.6 | 0.4 | 0.4 | 0.2 | 0.3 | 0.5 | 0.4 | ||
| [1997,2002) | 0.2 | 0.2 | 0.1 | 0.1 | 0.1 | 0.2 | 0.2 | 0.2 | 0.3 | 0.3 | 0.4 | 0.4 | 0.3 | 0.1 | 0.2 | 0.3 | 0.2 | ||
| [1992,1997) | 0.3 | 0.2 | 0.1 | 0.2 | 0.1 | 0.1 | 0.1 | 0.2 | 0.4 | 0.3 | 0.6 | 0.7 | 0.4 | 0.1 | 0.1 | 0.5 | 0.3 | ||
| [1987,1992) | 0.1 | 0.1 | 0.0 | 0.0 | 0.0 | 0.0 | 0.0 | 0.0 | 0.1 | 0.0 | 0.1 | 0.0 | 0.1 | 0.0 | 0.0 | 0.1 | 0.1 | ||
| Year | |||||||||||||||||||
| 2017 | 1.3 | 1.0 | 0.7 | 0.8 | 0.7 | 0.7 | 1.0 | 1.1 | 0.9 | 1.3 | 1.8 | 1.4 | 1.2 | 0.7 | 0.9 | 1.3 | 1.1 | ||
| 2016 | 1.5 | 1.2 | 0.9 | 0.9 | 1.1 | 1.0 | 1.1 | 1.2 | 1.3 | 1.3 | 1.7 | 1.4 | 1.4 | 1.0 | 1.1 | 1.4 | 1.2 | ||
| 2015 | 1.6 | 2.0 | 1.2 | 1.0 | 1.1 | 1.2 | 1.1 | 1.7 | 1.2 | 1.5 | 1.9 | 1.5 | 1.7 | 1.1 | 1.3 | 1.5 | 1.4 | ||
| 2014 | 1.1 | 1.1 | 0.5 | 0.9 | 0.9 | 0.7 | 1.0 | 1.6 | 1.2 | 1.6 | 2.6 | 1.2 | 1.2 | 0.8 | 1.1 | 1.7 | 1.2 | ||
| 2013 | 0.6 | 0.4 | 0.3 | 0.6 | 0.5 | 0.4 | 0.6 | 1.1 | 0.7 | 0.8 | 1.9 | 1.2 | 0.8 | 0.5 | 0.6 | 1.0 | 0.7 | ||
| 2012 | 0.7 | 0.5 | 0.3 | 0.5 | 0.3 | 0.4 | 0.6 | 0.6 | 0.6 | 0.5 | 0.9 | 0.8 | 0.7 | 0.4 | 0.6 | 0.6 | 0.5 | ||
| 2011 | 1.3 | 1.0 | 0.7 | 0.7 | 0.6 | 0.4 | 0.5 | 0.5 | 0.6 | 0.6 | 0.4 | 0.8 | 0.9 | 0.7 | 0.5 | 0.5 | 0.6 | ||
| 2010 | 1.7 | 0.5 | 0.6 | 0.8 | 0.7 | 0.6 | 1.1 | 1.0 | 1.2 | 0.5 | 2.3 | 0.7 | 0.9 | 0.7 | 0.9 | 1.1 | 0.9 | ||
| 2009 | 1.0 | 1.7 | 0.6 | 0.9 | 0.5 | 0.4 | 1.2 | 1.2 | 1.1 | 0.4 | 1.9 | 0.6 | 1.0 | 0.7 | 0.9 | 1.0 | 0.8 | ||
| 2008 | 0.5 | 0.6 | 0.5 | 0.5 | 0.7 | 0.3 | 0.9 | 0.7 | 0.7 | 0.5 | 1.7 | 0.9 | 0.7 | 0.5 | 0.6 | 0.8 | 0.6 | ||
| 2007 | 1.0 | 0.3 | 0.3 | 0.4 | 0.5 | 0.5 | 0.6 | 1.5 | 0.4 | 1.5 | 1.4 | 0.8 | 0.7 | 0.4 | 0.7 | 1.0 | 0.7 | ||
| 2006 | 0.3 | 1.2 | 0.3 | 0.5 | 0.3 | 0.3 | 0.5 | 0.7 | 0.6 | 0.9 | 0.8 | 0.6 | 0.7 | 0.4 | 0.5 | 0.7 | 0.6 | ||
| 2005 | 0.3 | 0.4 | 0.2 | 0.3 | 0.3 | 0.2 | 0.3 | 1.1 | 0.5 | 0.5 | 0.9 | 0.4 | 0.4 | 0.2 | 0.4 | 0.6 | 0.4 | ||
| 2004 | 0.3 | 0.4 | 0.3 | 0.2 | 0.1 | 0.1 | 0.2 | 0.7 | 0.9 | 0.9 | 0.2 | 0.4 | 0.4 | 0.2 | 0.3 | 0.8 | 0.4 | ||
| 2003 | 0.5 | 0.2 | 0.1 | 0.1 | 0.1 | 0.2 | 0.2 | 0.4 | 0.2 | 0.4 | 0.0 | 0.1 | 0.3 | 0.1 | 0.3 | 0.2 | 0.2 | ||
| 2002 | 0.6 | 0.1 | 0.1 | 0.1 | 0.1 | 0.2 | 0.2 | 0.2 | 0.3 | 0.1 | 0.8 | 0.4 | 0.4 | 0.1 | 0.2 | 0.3 | 0.2 | ||
| 2001 | 0.2 | 0.1 | 0.1 | 0.1 | 0.2 | 0.1 | 0.2 | 0.1 | 0.2 | 0.5 | 0.1 | 0.1 | 0.2 | 0.1 | 0.2 | 0.2 | 0.2 | ||
| 2000 | 0.1 | 0.5 | 0.2 | 0.1 | 0.2 | 0.1 | 0.2 | 0.3 | 0.2 | 0.3 | 0.9 | 0.5 | 0.4 | 0.2 | 0.2 | 0.4 | 0.3 | ||
| 1999 | 0.4 | 0.2 | 0.1 | 0.1 | 0.2 | 0.4 | 0.3 | 0.3 | 0.2 | 0.2 | 0.4 | 0.4 | 0.4 | 0.1 | 0.3 | 0.3 | 0.3 | ||
| 1998 | 0.4 | 0.1 | 0.2 | 0.0 | 0.0 | 0.2 | 0.2 | 0.1 | 0.6 | 0.2 | 0.9 | 0.4 | 0.3 | 0.1 | 0.2 | 0.5 | 0.2 | ||
| 1997 | 0.3 | 0.0 | 0.1 | 0.0 | 0.1 | 0.1 | 0.1 | 0.4 | 0.8 | 0.1 | 0.1 | 0.4 | 0.3 | 0.0 | 0.2 | 0.2 | 0.2 | ||
| 1996 | 0.6 | 0.1 | 0.1 | 0.1 | 0.1 | 0.1 | 0.1 | 0.1 | 0.2 | 0.2 | 0.2 | 0.5 | 0.4 | 0.1 | 0.1 | 0.2 | 0.2 | ||
| 1995 | 0.2 | 0.1 | 0.1 | 0.1 | 0.0 | 0.0 | 0.2 | 0.3 | 1.1 | 0.7 | 0.2 | 0.7 | 0.3 | 0.1 | 0.2 | 0.7 | 0.3 | ||
| 1994 | 0.4 | 0.5 | 0.4 | 0.3 | 0.2 | 0.0 | 0.2 | 0.1 | 0.1 | 0.1 | 0.8 | 0.6 | 0.5 | 0.3 | 0.1 | 0.3 | 0.3 | ||
| 1993 | 0.1 | 0.2 | 0.0 | 0.1 | 0.1 | 0.2 | 0.1 | 0.5 | 0.4 | 0.4 | 1.2 | 1.0 | 0.4 | 0.1 | 0.2 | 0.7 | 0.4 | ||
| 1992 | 0.1 | 0.0 | 0.1 | 0.1 | 0.3 | 0.1 | 0.1 | 0.2 | 0.2 | 0.4 | 0.5 | 0.7 | 0.3 | 0.1 | 0.1 | 0.4 | 0.2 | ||
| 1991 | 0.6 | 0.2 | 0.0 | 0.0 | 0.2 | 0.0 | 0.2 | 0.1 | 0.1 | 0.2 | 0.4 | 0.0 | 0.3 | 0.1 | 0.1 | 0.2 | 0.2 | ||
| 1990 | 0.0 | 0.0 | 0.0 | 0.0 | 0.0 | 0.0 | 0.0 | 0.1 | 0.3 | 0.1 | 0.3 | 0.1 | 0.1 | 0.0 | 0.0 | 0.2 | 0.1 | ||
| 1989 | 0.0 | 0.1 | 0.0 | 0.0 | 0.0 | 0.0 | 0.0 | 0.0 | 0.0 | 0.1 | 0.0 | 0.0 | 0.0 | 0.0 | 0.0 | 0.0 | 0.0 | ||
| 1988 | 0.0 | 0.0 | 0.1 | 0.1 | 0.0 | 0.0 | 0.0 | 0.0 | 0.0 | 0.0 | 0.0 | 0.0 | 0.0 | 0.0 | 0.0 | 0.0 | 0.0 | ||
| 1987 | 0.0 | 0.0 | 0.0 | 0.0 | 0.0 | 0.0 | 0.0 | 0.0 | 0.0 | 0.0 | 0.0 | 0.0 | 0.0 | 0.0 | 0.0 | 0.0 | 0.0 | ||
| 1986 | 0.2 | 0.0 | 0.0 | 0.0 | 0.0 | 0.0 | 0.0 | 0.0 | 0.0 | 0.0 | 0.0 | 0.0 | 0.1 | 0.0 | 0.0 | 0.0 | 0.0 | ||
| 1985 | 0.0 | 0.0 | 0.0 | 0.0 | 0.0 | 0.0 | 0.0 | 0.0 | 0.0 | 0.0 | 0.0 | 0.0 | 0.0 | 0.0 | 0.0 | 0.0 | 0.0 | ||
| 1984 | 0.0 | 0.0 | 0.0 | 0.0 | 0.0 | 0.0 | 0.0 | 0.0 | 0.0 | 0.0 | 0.0 | 0.0 | 0.0 | 0.0 | 0.0 | 0.0 | 0.0 | ||
| 1983 | 0.0 | 0.0 | 0.0 | 0.0 | 0.0 | 0.0 | 0.0 | 0.0 | 0.0 | - | 0.0 | 0.0 | 0.0 | 0.0 | 0.0 | 0.0 | 0.0 | ||
| 1982 | - | 0.0 | - | 0.0 | 0.0 | 0.0 | - | 0.0 | - | 0.0 | - | 0.0 | 0.0 | 0.0 | 0.0 | 0.0 | 0.0 | ||
Reporting rates
Reporting rate is the proportion of all surveys in which the species was present.
Reporting rate by year
This chart shows the reporting rate of Crested Pigeon each year between 1982 and 2017. 
Reporting rate by month
This chart shows the reporting rate by month of Crested Pigeon. The blue lines show the reporting rate for the twelve months to June 2017 and the bars show the average reporting rate for the period 1982 to 2017. 
Reporting rate by season
This chart shows the seasonal reporting rate of Crested Pigeon. The blue lines show the seasonal reporting rate for the twelve months to June 2017 and the bars show the average seasonal reporting rate for the period 1982 to 2017. 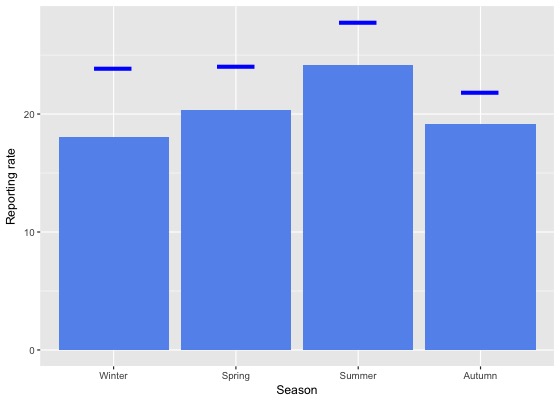
Reporting rate data
| Month | Season | ||||||||||||||||||
|---|---|---|---|---|---|---|---|---|---|---|---|---|---|---|---|---|---|---|---|
| Period | Jul | Aug | Sep | Oct | Nov | Dec | Jan | Feb | Mar | Apr | May | Jun | Winter | Spring | Summer | Autumn | All | ||
| All years | |||||||||||||||||||
| All | 18.7 | 20.4 | 19.5 | 21.1 | 20.0 | 20.5 | 27.5 | 24.6 | 19.2 | 18.4 | 20.0 | 15.7 | 18.0 | 20.3 | 24.2 | 19.1 | 20.5 | ||
| Previous years | |||||||||||||||||||
| All previous years | 17.6 | 19.2 | 18.8 | 20.7 | 19.5 | 19.8 | 26.9 | 24.0 | 18.5 | 17.9 | 19.9 | 14.8 | 16.9 | 19.8 | 23.5 | 18.6 | 19.9 | ||
| Previous 30 years | 17.8 | 19.6 | 19.1 | 20.9 | 19.9 | 20.2 | 27.2 | 24.4 | 18.7 | 18.2 | 20.2 | 15.1 | 17.2 | 20.1 | 23.9 | 18.9 | 20.2 | ||
| Previous 20 years | 21.6 | 24.6 | 21.8 | 23.6 | 24.5 | 23.1 | 31.1 | 28.6 | 20.9 | 20.7 | 24.1 | 16.9 | 20.4 | 23.3 | 27.6 | 21.6 | 23.4 | ||
| 10 year groups | |||||||||||||||||||
| [2007,2017) | 27.9 | 29.4 | 26.3 | 26.7 | 30.2 | 28.8 | 35.3 | 33.1 | 25.2 | 24.1 | 28.8 | 20.2 | 25.0 | 27.4 | 32.5 | 25.7 | 27.9 | ||
| [1997,2007) | 10.8 | 14.0 | 12.7 | 12.9 | 12.9 | 12.4 | 17.3 | 17.0 | 11.7 | 11.8 | 12.6 | 9.8 | 11.2 | 12.9 | 15.1 | 12.0 | 12.8 | ||
| [1987,1997) | 4.7 | 4.5 | 4.8 | 5.2 | 4.7 | 3.5 | 3.9 | 4.9 | 6.1 | 5.0 | 5.6 | 6.0 | 5.0 | 4.9 | 4.1 | 5.5 | 4.9 | ||
| 5 year groups | |||||||||||||||||||
| [2012,2017) | 30.5 | 31.4 | 27.9 | 28.4 | 31.8 | 32.1 | 36.4 | 34.2 | 27.0 | 27.2 | 30.4 | 23.0 | 27.8 | 29.1 | 34.5 | 27.9 | 30.1 | ||
| [2007,2012) | 20.4 | 22.2 | 22.7 | 23.8 | 25.8 | 21.6 | 31.2 | 28.3 | 20.2 | 17.1 | 24.3 | 15.1 | 18.0 | 23.9 | 26.4 | 19.8 | 22.4 | ||
| [2002,2007) | 12.4 | 16.6 | 14.5 | 15.5 | 15.0 | 14.2 | 20.4 | 20.2 | 13.0 | 12.7 | 14.0 | 10.5 | 12.6 | 15.0 | 17.5 | 13.1 | 14.6 | ||
| [1997,2002) | 8.3 | 10.8 | 10.5 | 9.2 | 10.6 | 9.9 | 13.9 | 13.8 | 10.1 | 10.7 | 10.9 | 8.8 | 9.2 | 10.1 | 12.2 | 10.5 | 10.6 | ||
| [1992,1997) | 8.6 | 5.3 | 6.4 | 7.9 | 8.3 | 5.0 | 5.6 | 9.3 | 9.3 | 7.8 | 10.1 | 11.8 | 8.5 | 7.6 | 6.4 | 9.0 | 7.9 | ||
| [1987,1992) | 2.9 | 4.0 | 4.1 | 3.8 | 3.0 | 2.8 | 3.0 | 3.2 | 4.2 | 3.4 | 3.2 | 2.7 | 3.2 | 3.6 | 3.0 | 3.6 | 3.4 | ||
| Year | |||||||||||||||||||
| 2017 | 26.1 | 26.9 | 24.6 | 24.5 | 23.1 | 25.0 | 30.4 | 27.3 | 23.0 | 21.9 | 20.5 | 20.5 | 23.9 | 24.1 | 27.8 | 21.8 | 24.5 | ||
| 2016 | 30.8 | 27.5 | 28.0 | 28.2 | 33.5 | 31.9 | 32.9 | 28.4 | 27.9 | 26.8 | 28.5 | 26.4 | 28.1 | 29.5 | 31.0 | 27.6 | 29.1 | ||
| 2015 | 31.7 | 41.8 | 32.0 | 29.2 | 30.1 | 34.7 | 35.7 | 38.0 | 26.3 | 27.9 | 34.2 | 24.6 | 31.3 | 30.3 | 36.1 | 29.0 | 31.8 | ||
| 2014 | 32.7 | 30.7 | 24.4 | 30.8 | 29.3 | 25.8 | 41.4 | 37.4 | 26.9 | 28.9 | 32.7 | 21.9 | 26.8 | 28.6 | 37.1 | 28.9 | 30.9 | ||
| 2013 | 24.1 | 22.6 | 24.5 | 22.7 | 32.1 | 33.7 | 45.5 | 42.5 | 28.9 | 33.5 | 27.6 | 17.7 | 21.2 | 25.8 | 40.1 | 30.3 | 30.5 | ||
| 2012 | 32.0 | 34.3 | 27.4 | 30.3 | 33.1 | 29.9 | 29.9 | 32.2 | 22.9 | 18.2 | 27.8 | 17.8 | 27.1 | 30.2 | 30.3 | 22.0 | 28.0 | ||
| 2011 | 26.0 | 25.6 | 23.3 | 24.6 | 20.6 | 27.1 | 36.7 | 29.7 | 21.6 | 19.4 | 23.6 | 19.5 | 22.1 | 23.5 | 31.4 | 21.4 | 24.8 | ||
| 2010 | 21.9 | 15.8 | 27.3 | 27.4 | 26.3 | 21.8 | 34.8 | 36.5 | 19.3 | 13.6 | 27.5 | 16.4 | 17.4 | 27.1 | 28.7 | 18.4 | 23.7 | ||
| 2009 | 23.0 | 31.2 | 23.7 | 23.9 | 25.0 | 16.4 | 28.0 | 21.7 | 25.6 | 14.3 | 17.6 | 14.4 | 20.6 | 24.1 | 21.6 | 19.2 | 21.9 | ||
| 2008 | 12.4 | 24.3 | 18.0 | 21.5 | 26.8 | 17.6 | 31.7 | 23.1 | 16.1 | 15.8 | 23.4 | 15.0 | 16.5 | 21.3 | 22.8 | 17.3 | 19.7 | ||
| 2007 | 19.8 | 14.8 | 21.2 | 22.2 | 31.1 | 21.5 | 22.4 | 31.3 | 17.9 | 21.8 | 30.9 | 9.8 | 12.6 | 23.5 | 23.5 | 22.1 | 21.1 | ||
| 2006 | 13.2 | 27.2 | 15.9 | 18.7 | 16.1 | 14.0 | 28.1 | 28.9 | 15.5 | 14.5 | 16.7 | 12.3 | 15.5 | 17.3 | 23.2 | 15.5 | 17.6 | ||
| 2005 | 12.5 | 20.6 | 13.0 | 17.7 | 12.4 | 14.7 | 19.1 | 21.7 | 18.2 | 14.2 | 16.9 | 11.1 | 13.5 | 14.3 | 17.4 | 16.6 | 15.4 | ||
| 2004 | 11.9 | 12.5 | 14.4 | 16.3 | 12.2 | 10.1 | 15.8 | 13.1 | 9.8 | 12.1 | 9.7 | 8.6 | 11.1 | 14.3 | 12.7 | 10.7 | 12.2 | ||
| 2003 | 15.4 | 14.4 | 15.3 | 12.4 | 18.8 | 17.4 | 17.0 | 20.9 | 10.8 | 13.4 | 9.3 | 8.7 | 12.5 | 15.6 | 18.4 | 11.4 | 14.6 | ||
| 2002 | 10.3 | 11.9 | 14.4 | 10.3 | 14.0 | 14.5 | 20.8 | 15.1 | 8.6 | 8.9 | 15.3 | 10.2 | 10.6 | 12.8 | 16.2 | 9.9 | 12.7 | ||
| 2001 | 8.9 | 9.0 | 10.1 | 13.9 | 17.6 | 13.0 | 17.5 | 14.9 | 9.6 | 13.7 | 9.2 | 8.4 | 8.8 | 13.0 | 14.9 | 10.7 | 12.0 | ||
| 2000 | 11.1 | 21.6 | 15.8 | 12.8 | 14.4 | 8.7 | 13.2 | 16.2 | 11.0 | 13.7 | 17.3 | 14.0 | 15.7 | 14.3 | 12.3 | 13.3 | 13.7 | ||
| 1999 | 8.8 | 6.2 | 10.9 | 5.0 | 9.7 | 10.6 | 13.9 | 12.9 | 9.7 | 9.8 | 9.7 | 7.9 | 7.5 | 8.6 | 12.4 | 9.7 | 9.6 | ||
| 1998 | 5.4 | 5.7 | 7.3 | 1.1 | 2.7 | 8.5 | 8.8 | 5.7 | 5.4 | 7.7 | 11.1 | 4.0 | 4.8 | 4.0 | 7.9 | 6.9 | 5.7 | ||
| 1997 | 3.4 | 0.0 | 4.5 | 2.6 | 1.7 | 5.8 | 9.8 | 10.5 | 20.0 | 1.8 | 6.7 | 4.2 | 2.8 | 3.0 | 8.0 | 6.7 | 4.9 | ||
| 1996 | 7.5 | 3.2 | 5.3 | 4.4 | 9.3 | 5.1 | 4.9 | 5.9 | 5.9 | 3.1 | 5.2 | 4.6 | 4.8 | 6.4 | 5.2 | 4.9 | 5.4 | ||
| 1995 | 7.5 | 4.7 | 5.8 | 6.7 | 3.6 | 4.6 | 8.0 | 11.1 | 17.3 | 11.3 | 10.4 | 8.5 | 6.6 | 5.6 | 7.6 | 13.0 | 8.0 | ||
| 1994 | 19.6 | 11.7 | 14.7 | 12.8 | 14.0 | 2.2 | 2.9 | 6.9 | 4.5 | 5.3 | 10.0 | 19.1 | 16.6 | 13.8 | 4.1 | 6.4 | 10.4 | ||
| 1993 | 6.1 | 5.1 | 1.6 | 8.0 | 4.5 | 10.9 | 4.1 | 12.5 | 9.9 | 6.7 | 11.7 | 13.0 | 8.2 | 4.9 | 8.7 | 9.6 | 7.8 | ||
| 1992 | 4.6 | 1.9 | 4.7 | 9.6 | 6.9 | 3.2 | 6.9 | 14.6 | 8.5 | 11.9 | 11.8 | 15.0 | 7.3 | 7.2 | 7.4 | 10.7 | 8.1 | ||
| 1991 | 6.3 | 1.1 | 2.3 | 1.0 | 7.2 | 0.0 | 5.4 | 4.0 | 3.2 | 3.4 | 8.2 | 2.0 | 3.7 | 3.5 | 2.8 | 4.9 | 3.7 | ||
| 1990 | 3.2 | 3.8 | 2.2 | 4.1 | 0.9 | 1.4 | 1.4 | 2.8 | 11.4 | 4.8 | 5.5 | 2.6 | 3.4 | 2.3 | 1.9 | 7.3 | 3.7 | ||
| 1989 | 2.0 | 6.0 | 3.5 | 4.6 | 3.5 | 3.5 | 3.2 | 3.6 | 5.0 | 5.1 | 2.6 | 3.0 | 3.9 | 3.9 | 3.4 | 4.4 | 3.9 | ||
| 1988 | 1.7 | 3.7 | 6.7 | 5.1 | 2.8 | 3.1 | 2.5 | 2.9 | 2.5 | 2.7 | 2.0 | 2.4 | 2.7 | 4.6 | 2.8 | 2.4 | 3.2 | ||
| 1987 | 0.0 | 0.0 | 4.0 | 2.7 | 2.4 | 3.3 | 3.1 | 2.9 | 2.4 | 2.1 | 2.6 | 2.9 | 2.6 | 3.0 | 3.1 | 2.3 | 2.8 | ||
| 1986 | 3.8 | 0.0 | 0.0 | 0.0 | 0.0 | 0.0 | 0.0 | 0.0 | 0.0 | 0.0 | 0.0 | 0.0 | 1.0 | 0.0 | 0.0 | 0.0 | 0.2 | ||
| 1985 | 0.0 | 0.0 | 0.0 | 0.0 | 0.0 | 0.0 | 0.0 | 0.0 | 0.0 | 0.0 | 0.0 | 0.0 | 0.0 | 0.0 | 0.0 | 0.0 | 0.0 | ||
| 1984 | 0.0 | 0.0 | 0.0 | 0.0 | 0.0 | 0.0 | 0.0 | 0.0 | 0.0 | 0.0 | 0.0 | 0.0 | 0.0 | 0.0 | 0.0 | 0.0 | 0.0 | ||
| 1983 | 0.0 | 0.0 | 0.0 | 0.0 | 0.0 | 0.0 | 0.0 | 0.0 | 0.0 | - | 0.0 | 0.0 | 0.0 | 0.0 | 0.0 | 0.0 | 0.0 | ||
| 1982 | - | 0.0 | - | 0.0 | 0.0 | 0.0 | - | 0.0 | - | 0.0 | - | 0.0 | 0.0 | 0.0 | 0.0 | 0.0 | 0.0 | ||
Breeding data
Breeding records by month
Number of breeding records by breeding code and month, 2017 and all years| Breeding code | Jul | Aug | Sep | Oct | Nov | Dec | Jan | Feb | Mar | Apr | May | Jun |
|---|---|---|---|---|---|---|---|---|---|---|---|---|
| 2017 | ||||||||||||
| Breeding (BLA code) | 0 | 0 | 0 | 0 | 0 | 1 | 0 | 0 | 0 | 0 | 0 | 0 |
| Carrying Food | 0 | 0 | 0 | 0 | 0 | 0 | 0 | 0 | 0 | 0 | 0 | 0 |
| Copulating | 0 | 0 | 1 | 0 | 0 | 0 | 0 | 0 | 0 | 0 | 0 | 0 |
| Display | 0 | 2 | 3 | 5 | 3 | 2 | 3 | 1 | 0 | 0 | 1 | 0 |
| Dependent young | 0 | 0 | 0 | 1 | 0 | 0 | 1 | 0 | 0 | 1 | 0 | 0 |
| Faecal sac | 0 | 0 | 0 | 0 | 0 | 0 | 0 | 0 | 0 | 0 | 0 | 0 |
| Inspecting hollow | 0 | 0 | 0 | 0 | 0 | 0 | 0 | 0 | 0 | 0 | 0 | 0 |
| Nest building | 0 | 1 | 1 | 0 | 5 | 0 | 0 | 0 | 1 | 0 | 0 | 0 |
| Nest with eggs | 0 | 0 | 0 | 0 | 0 | 0 | 0 | 0 | 0 | 0 | 0 | 0 |
| Nest with young | 0 | 0 | 0 | 0 | 0 | 1 | 0 | 0 | 0 | 0 | 0 | 0 |
| On/leaving nest | 0 | 0 | 0 | 2 | 1 | 0 | 0 | 0 | 0 | 0 | 0 | 0 |
| All years | ||||||||||||
| Breeding (BLA code) | 1 | 1 | 7 | 12 | 3 | 2 | 2 | 1 | 1 | 0 | 0 | 0 |
| Carrying Food | 0 | 0 | 0 | 0 | 0 | 0 | 0 | 0 | 0 | 0 | 0 | 0 |
| Copulating | 0 | 0 | 1 | 1 | 0 | 0 | 0 | 0 | 0 | 0 | 0 | 0 |
| Display | 2 | 2 | 6 | 34 | 11 | 5 | 7 | 3 | 1 | 1 | 1 | 1 |
| Dependent young | 0 | 0 | 1 | 4 | 5 | 3 | 1 | 2 | 1 | 2 | 1 | 0 |
| Faecal sac | 0 | 0 | 0 | 0 | 0 | 0 | 0 | 0 | 0 | 0 | 0 | 0 |
| Inspecting hollow | 0 | 0 | 0 | 0 | 0 | 0 | 0 | 0 | 0 | 0 | 0 | 0 |
| Nest building | 0 | 3 | 7 | 7 | 13 | 1 | 1 | 2 | 5 | 0 | 0 | 0 |
| Nest with eggs | 2 | 0 | 1 | 1 | 0 | 0 | 0 | 0 | 1 | 0 | 0 | 1 |
| Nest with young | 0 | 0 | 0 | 3 | 2 | 2 | 3 | 0 | 1 | 1 | 0 | 0 |
| On/leaving nest | 1 | 4 | 7 | 27 | 8 | 7 | 4 | 4 | 3 | 0 | 0 | 0 |
Breeding records by year
Average number of breeding records per period by breeding code| Period | Breeding (BLA code) | Carrying Food | Copulating | Display | Dependent young | Faecal sac | Inspecting hollow | Nest building | Nest with eggs | Nest with young | On/leaving nest |
|---|---|---|---|---|---|---|---|---|---|---|---|
| All years | |||||||||||
| All | 0.8 | 0.0 | 0.1 | 2.1 | 0.6 | 0.0 | 0.0 | 1.1 | 0.2 | 0.3 | 1.8 |
| Previous years | |||||||||||
| All previous years | 0.8 | 0.0 | 0.0 | 1.5 | 0.5 | 0.0 | 0.0 | 0.9 | 0.2 | 0.3 | 1.8 |
| Previous 30 years | 1.0 | 0.0 | 0.0 | 1.8 | 0.6 | 0.0 | 0.0 | 1.0 | 0.2 | 0.4 | 2.1 |
| Previous 20 years | 1.4 | 0.0 | 0.0 | 2.6 | 0.8 | 0.0 | 0.0 | 1.1 | 0.3 | 0.5 | 3.0 |
| 10 year groups | |||||||||||
| [2007,2017) | 1.7 | 0.0 | 0.1 | 4.3 | 1.4 | 0.0 | 0.0 | 2.2 | 0.2 | 0.5 | 4.5 |
| [1997,2007) | 1.2 | 0.0 | 0.0 | 1.0 | 0.2 | 0.0 | 0.0 | 0.1 | 0.4 | 0.4 | 1.6 |
| [1987,1997) | 0.0 | 0.0 | 0.0 | 0.1 | 0.1 | 0.0 | 0.0 | 0.8 | 0.0 | 0.2 | 0.1 |
| 5 year groups | |||||||||||
| [2012,2017) | 1.0 | 0.0 | 0.2 | 5.2 | 2.2 | 0.0 | 0.0 | 2.6 | 0.4 | 0.0 | 4.4 |
| [2007,2012) | 2.4 | 0.0 | 0.0 | 3.4 | 0.6 | 0.0 | 0.0 | 1.8 | 0.0 | 1.0 | 4.6 |
| [2002,2007) | 0.4 | 0.0 | 0.0 | 1.0 | 0.4 | 0.0 | 0.0 | 0.0 | 0.0 | 0.4 | 2.0 |
| [1997,2002) | 2.0 | 0.0 | 0.0 | 1.0 | 0.0 | 0.0 | 0.0 | 0.2 | 0.8 | 0.4 | 1.2 |
| [1992,1997) | 0.0 | 0.0 | 0.0 | 0.2 | 0.0 | 0.0 | 0.0 | 0.6 | 0.0 | 0.0 | 0.2 |
| [1987,1992) | 0.0 | 0.0 | 0.0 | 0.0 | 0.2 | 0.0 | 0.0 | 1.0 | 0.0 | 0.4 | 0.0 |
| Year | |||||||||||
| 2017 | 1.0 | 0.0 | 1.0 | 20.0 | 3.0 | 0.0 | 0.0 | 8.0 | 0.0 | 1.0 | 3.0 |
| 2016 | 0.0 | 0.0 | 0.0 | 8.0 | 7.0 | 0.0 | 0.0 | 4.0 | 0.0 | 0.0 | 13.0 |
| 2015 | 0.0 | 0.0 | 0.0 | 8.0 | 2.0 | 0.0 | 0.0 | 5.0 | 1.0 | 0.0 | 1.0 |
| 2014 | 0.0 | 0.0 | 0.0 | 4.0 | 1.0 | 0.0 | 0.0 | 1.0 | 1.0 | 0.0 | 3.0 |
| 2013 | 0.0 | 0.0 | 1.0 | 4.0 | 0.0 | 0.0 | 0.0 | 1.0 | 0.0 | 0.0 | 3.0 |
| 2012 | 5.0 | 0.0 | 0.0 | 2.0 | 1.0 | 0.0 | 0.0 | 2.0 | 0.0 | 0.0 | 2.0 |
| 2011 | 0.0 | 0.0 | 0.0 | 3.0 | 1.0 | 0.0 | 0.0 | 2.0 | 0.0 | 0.0 | 7.0 |
| 2010 | 0.0 | 0.0 | 0.0 | 4.0 | 0.0 | 0.0 | 0.0 | 2.0 | 0.0 | 1.0 | 0.0 |
| 2009 | 1.0 | 0.0 | 0.0 | 7.0 | 0.0 | 0.0 | 0.0 | 2.0 | 0.0 | 1.0 | 3.0 |
| 2008 | 2.0 | 0.0 | 0.0 | 0.0 | 1.0 | 0.0 | 0.0 | 1.0 | 0.0 | 1.0 | 9.0 |
| 2007 | 9.0 | 0.0 | 0.0 | 3.0 | 1.0 | 0.0 | 0.0 | 2.0 | 0.0 | 2.0 | 4.0 |
| 2006 | 0.0 | 0.0 | 0.0 | 4.0 | 1.0 | 0.0 | 0.0 | 0.0 | 0.0 | 1.0 | 2.0 |
| 2005 | 1.0 | 0.0 | 0.0 | 1.0 | 1.0 | 0.0 | 0.0 | 0.0 | 0.0 | 0.0 | 4.0 |
| 2004 | 1.0 | 0.0 | 0.0 | 0.0 | 0.0 | 0.0 | 0.0 | 0.0 | 0.0 | 1.0 | 1.0 |
| 2003 | 0.0 | 0.0 | 0.0 | 0.0 | 0.0 | 0.0 | 0.0 | 0.0 | 0.0 | 0.0 | 1.0 |
| 2002 | 0.0 | 0.0 | 0.0 | 0.0 | 0.0 | 0.0 | 0.0 | 0.0 | 0.0 | 0.0 | 2.0 |
| 2001 | 10.0 | 0.0 | 0.0 | 1.0 | 0.0 | 0.0 | 0.0 | 0.0 | 2.0 | 1.0 | 2.0 |
| 2000 | 0.0 | 0.0 | 0.0 | 2.0 | 0.0 | 0.0 | 0.0 | 0.0 | 1.0 | 0.0 | 0.0 |
| 1999 | 0.0 | 0.0 | 0.0 | 2.0 | 0.0 | 0.0 | 0.0 | 0.0 | 0.0 | 0.0 | 2.0 |
| 1998 | 0.0 | 0.0 | 0.0 | 0.0 | 0.0 | 0.0 | 0.0 | 1.0 | 0.0 | 1.0 | 1.0 |
| 1997 | 0.0 | 0.0 | 0.0 | 0.0 | 0.0 | 0.0 | 0.0 | 0.0 | 1.0 | 0.0 | 1.0 |
| 1996 | 0.0 | 0.0 | 0.0 | 0.0 | 0.0 | 0.0 | 0.0 | 0.0 | 0.0 | 0.0 | 1.0 |
| 1995 | 0.0 | 0.0 | 0.0 | 0.0 | 0.0 | 0.0 | 0.0 | 1.0 | 0.0 | 0.0 | 0.0 |
| 1994 | 0.0 | 0.0 | 0.0 | 0.0 | 0.0 | 0.0 | 0.0 | 1.0 | 0.0 | 0.0 | 0.0 |
| 1993 | 0.0 | 0.0 | 0.0 | 0.0 | 0.0 | 0.0 | 0.0 | 0.0 | 0.0 | 0.0 | 0.0 |
| 1992 | 0.0 | 0.0 | 0.0 | 1.0 | 0.0 | 0.0 | 0.0 | 1.0 | 0.0 | 0.0 | 0.0 |
| 1991 | 0.0 | 0.0 | 0.0 | 0.0 | 0.0 | 0.0 | 0.0 | 0.0 | 0.0 | 0.0 | 0.0 |
| 1990 | 0.0 | 0.0 | 0.0 | 0.0 | 0.0 | 0.0 | 0.0 | 1.0 | 0.0 | 0.0 | 0.0 |
| 1989 | 0.0 | 0.0 | 0.0 | 0.0 | 0.0 | 0.0 | 0.0 | 4.0 | 0.0 | 2.0 | 0.0 |
| 1988 | 0.0 | 0.0 | 0.0 | 0.0 | 1.0 | 0.0 | 0.0 | 0.0 | 0.0 | 0.0 | 0.0 |
| 1987 | 0.0 | 0.0 | 0.0 | 0.0 | 0.0 | 0.0 | 0.0 | 0.0 | 0.0 | 0.0 | 0.0 |
| 1986 | 0.0 | 0.0 | 0.0 | 0.0 | 0.0 | 0.0 | 0.0 | 0.0 | 0.0 | 0.0 | 0.0 |
| 1985 | 0.0 | 0.0 | 0.0 | 0.0 | 0.0 | 0.0 | 0.0 | 0.0 | 0.0 | 0.0 | 0.0 |
| 1984 | 0.0 | 0.0 | 0.0 | 0.0 | 0.0 | 0.0 | 0.0 | 0.0 | 0.0 | 0.0 | 0.0 |
| 1983 | 0.0 | 0.0 | 0.0 | 0.0 | 0.0 | 0.0 | 0.0 | 0.0 | 0.0 | 0.0 | 0.0 |
| 1982 | 0.0 | 0.0 | 0.0 | 0.0 | 0.0 | 0.0 | 0.0 | 0.0 | 0.0 | 0.0 | 0.0 |
Distribution map
Distribution - 2017
This map shows the observed distribution of the Crested Pigeon for 2017.
The red circles are the grid cells where Crested Pigeon have been reported.
The transparency of the red circles indicate how many surveys sheets were submitted for that grid cell; the darker the red the more reliable the data. Of the 315 grid cells with reports, 83 had only one sheet; an example is grid number F5.
The size of the circle represents the reporting rate. The maximum reporting rate for Crested Pigeon was 100.0% (eg grid number F5) and the minimum was 1.4% (eg grid number Q13). 
Distribution - all years
This map shows the observed distribution of the Crested Pigeon for all years.
The red circles are the grid cells where Crested Pigeon have been reported.
The transparency of the red circles indicate how many surveys sheets were submitted for that grid cell; the darker the red the more reliable the data. Of the 703 grid cells with reports, 55 had only one sheet; an example is grid number X21.
The size of the circle represents the reporting rate. The maximum reporting rate for Crested Pigeon was 100.0% (eg grid number X21) and the minimum was 0.4% (eg grid number E15). 
Breeding map
Breeding - 2017
This map shows the breeding distribution of the Crested Pigeon for 2017.
The red circles are the grid cells where breeding activity for Crested Pigeon have been reported.
The size of the circle represents the number of reports. 
Breeding - all years
This map shows the breeding distribution of the Crested Pigeon for all years.
The red circles are the grid cells where breeding activity for Crested Pigeon have been reported.
The size of the circle represents the number of reports. 